Plazi
  • treatmentbank
  • Biodiversity Literature Repository
  • Services
  • How to Participate
  • About

Visualization Tools

June 13, 2021

Visualization Tools

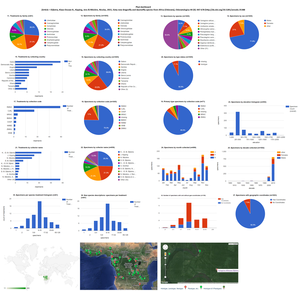
All the data extracted from the taxonomic literature is available for visualization. For that Plazi offers a tool to create a number of Google Charts. Please read the documentation on using the visualization tools and an overview of the available fields.

  • Treatment Bank
  • Data, API and Tools
Supported in part by The Arcadia Fund | Privacy | Legal Disclaimer
© 2023 Plazi. Published under CC0 Public Domain Dedication